Reports and Dashboard
Dashboard is the default page when you first log into the merchant website. At a glance, you can overview various performance indicators and trends of the merchant and quickly grasp the current state of affairs. Report page extends the functionality of the dashboard by offering you the ability to filter data based on specific time ranges.
Sales Report
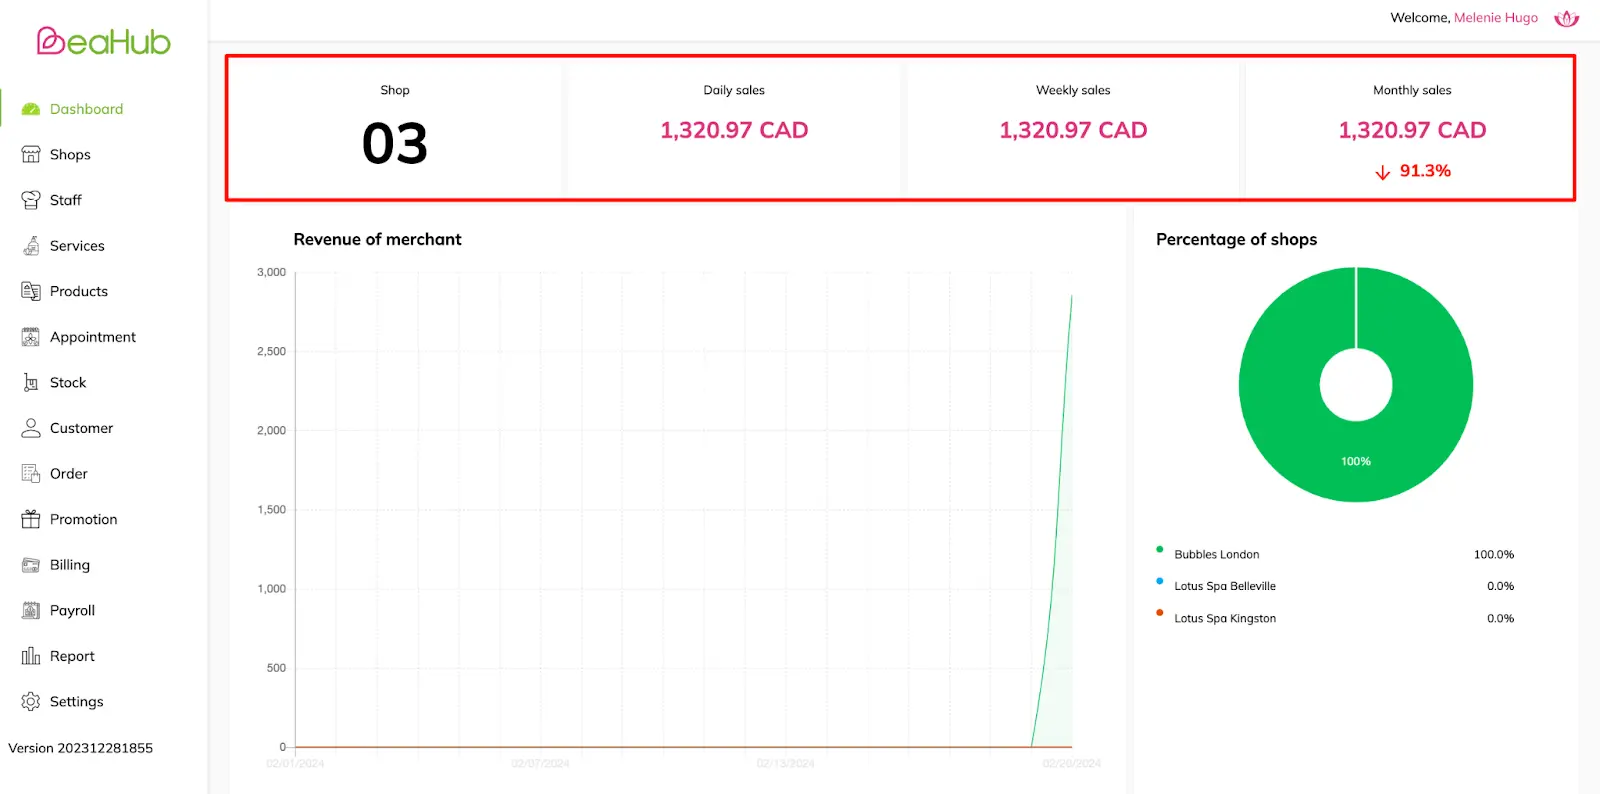
Sales Reports on the Dashboard include:
1) Number of shops/locations, as well as Daily, weekly & monthly sales of the whole merchant

Merchant statistics
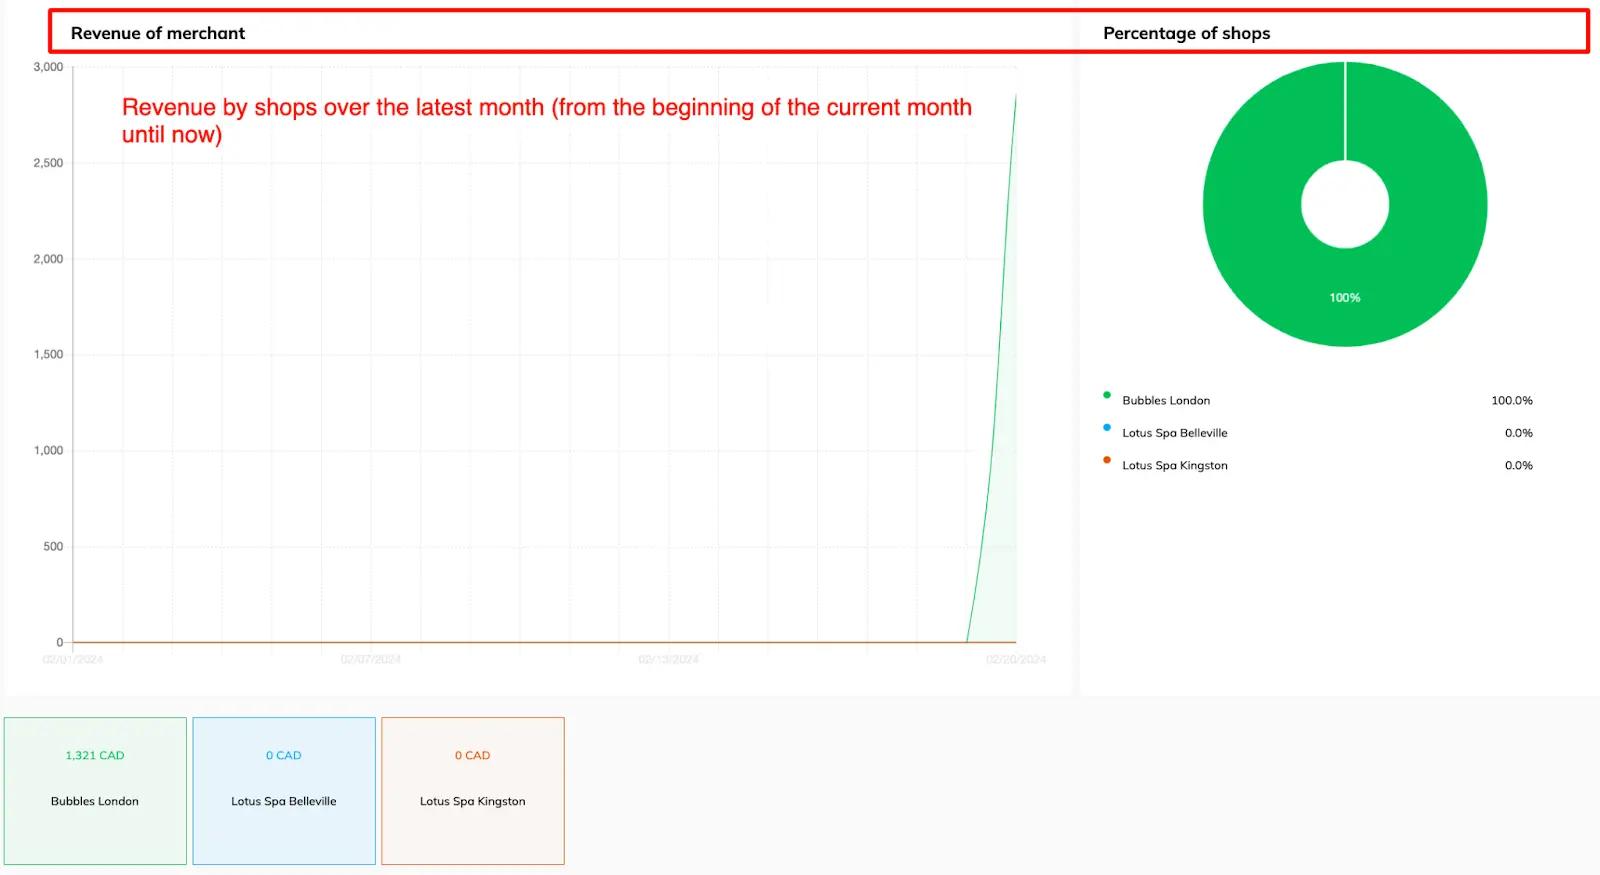
2) Sales over the latest month (from the beginning of the current month until now)

Revenue by shops over the current month

Revenue by products & services over the current month
Report
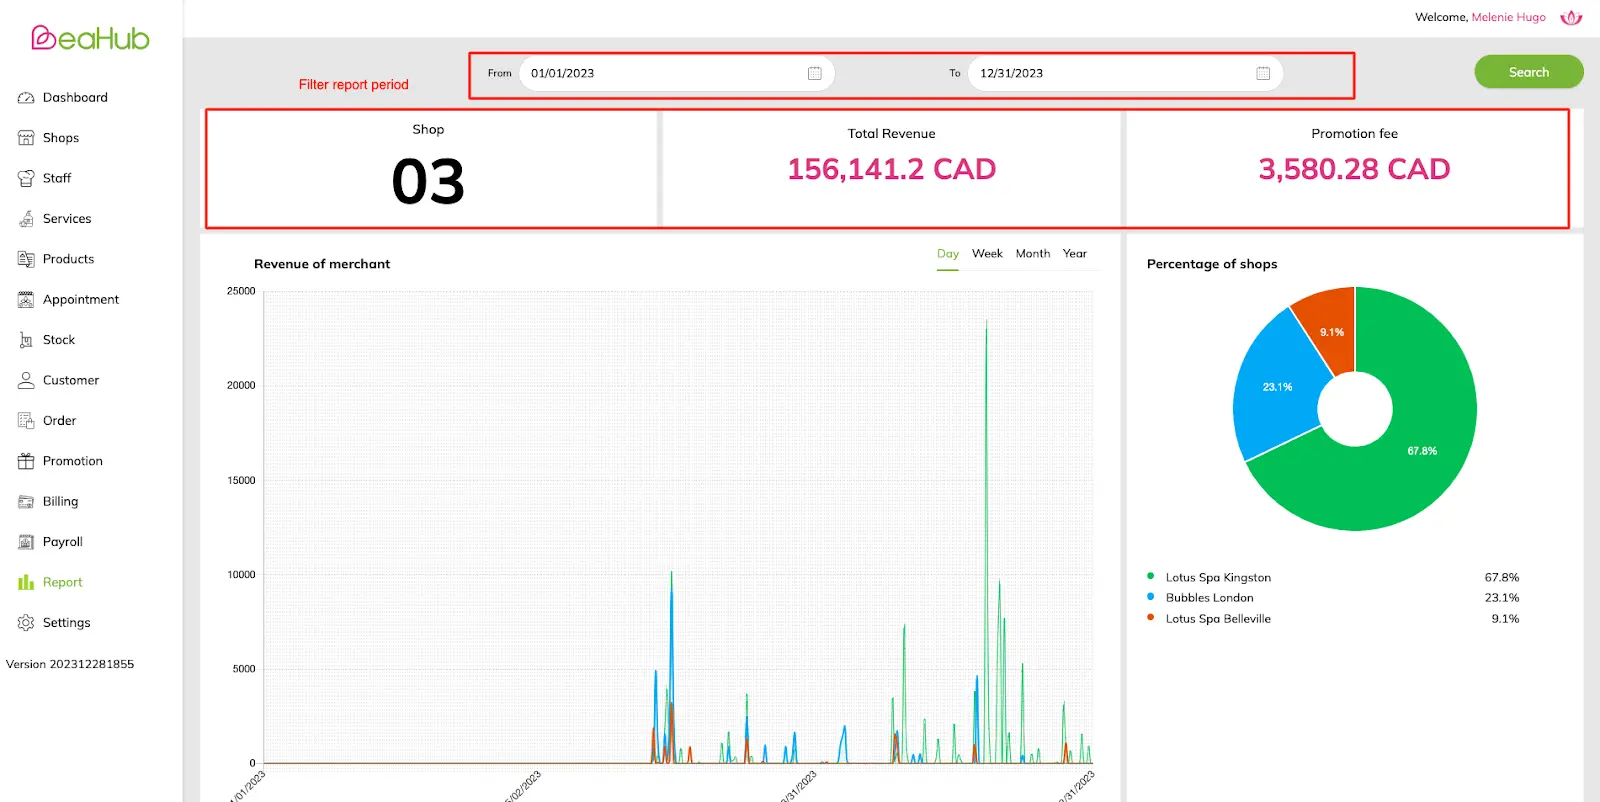
Sales Reports on the Report page include:
1) Number of shops/locations, total revenue and promotion fee of the merchant

Merchant statistics
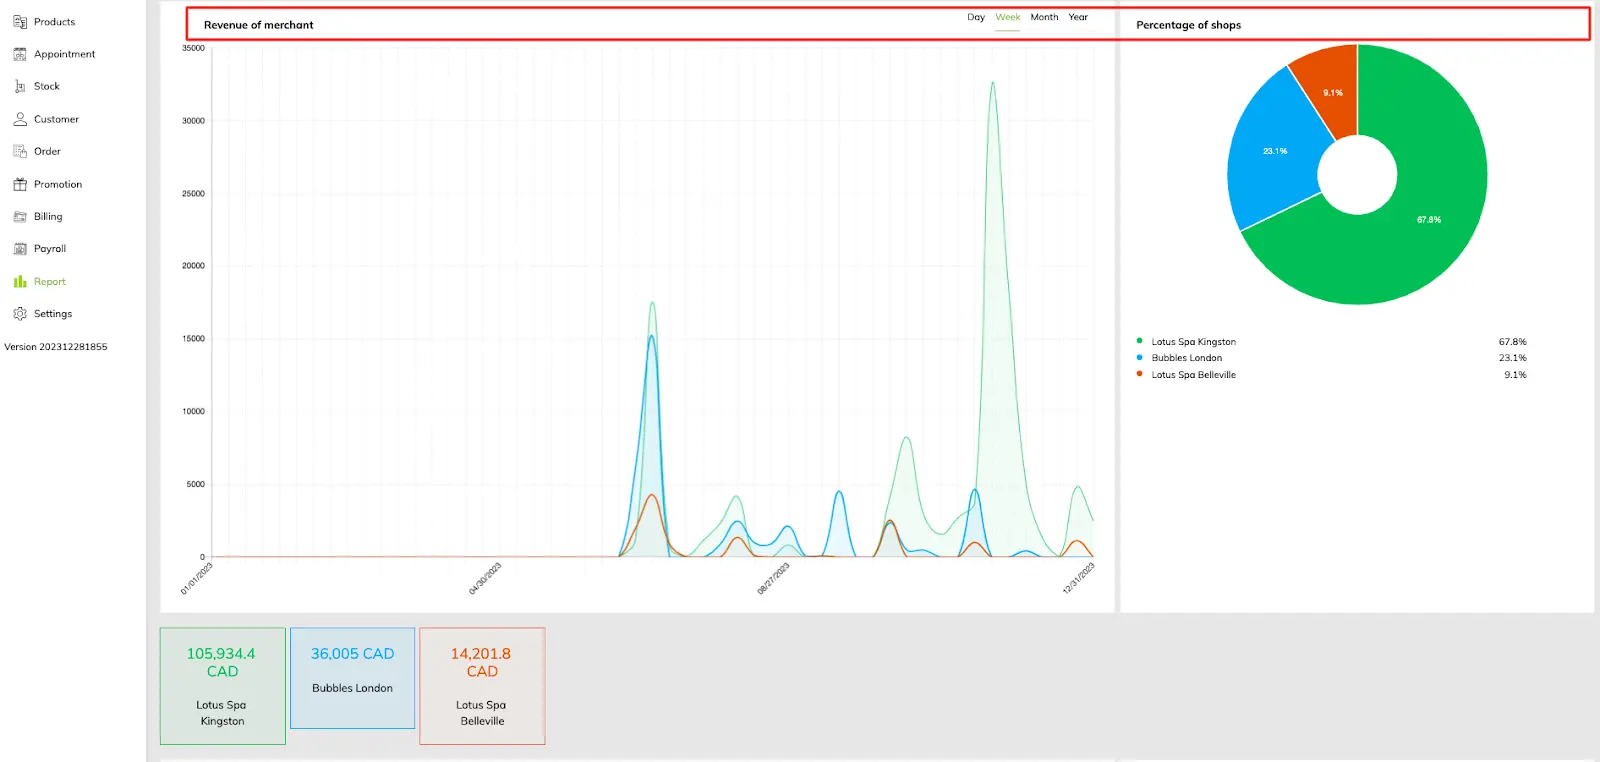
2) Shop revenue changes and revenue by shop over the filtered period

Revenue by shops over the filtered period

Revenue by products & services over the filtered period